Scientific and Interactive Blocks – inseri core
by inseriswiss on WordPress.org
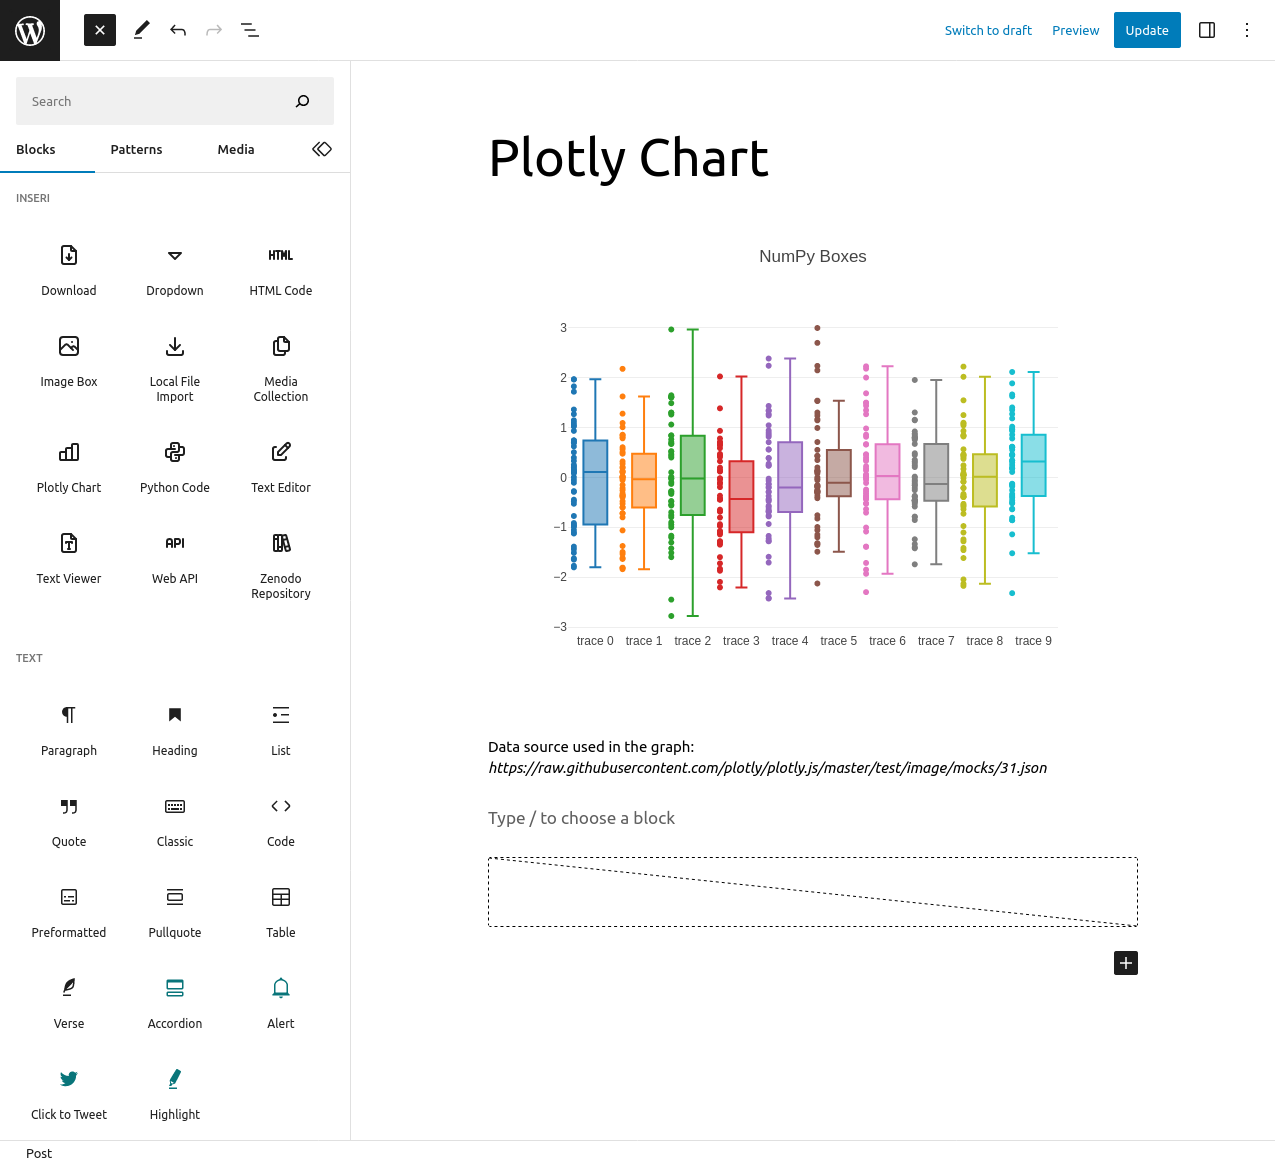
Create beautiful charts with Plotly
The vision of inseri is to enable scholars to design and publish interactive and executable online content without requiring web development skills. So that they can publish with ease the research findings in an open, citable and interactive way for effortless reuse by any researcher or the general public. Through interactivity, everyone is encouraged to edit the parameters, use own data, or reuse publicly published data to explore the research findings.
As a result, inseri core introduces scientific and interactive Gutenberg blocks to facilitate open access and open science communication. The inseri core blocks are not isolated elements but they can receive input from and give output to other blocks. A typical example would start with a Text Editor block containing the configuration for a Dropdown block. By selecting one option in the Dropdown block would provide a Web API block with the parameters to retrieve data from an external source. Using a Python Code block, the web API response could then be transformed into a suitable data format for a Plotly Chart block.
Blocks:
- Cytoscape Block: It displays network diagram using the data of another block with Cytoscape.
- Data Table Block: It displays tabular data of another block and gives guests the option to explore it.
- Download Block: It gives guests the possibility to download data from another block.
- Dropdown Block: It provides guests options to choose from and the selected option can be reused in other blocks.
- Export Block: It makes the post or page content open access by allowing the visitors to download the corresponding blueprint.json and WXR file.
- HTML Code Block: It renders HTML code using the other block’s data.
- IIIF Viewer Block: It showcases images with pan/zoom functionality, along with videos and audios consumed by an IIIF API.
- Image Box Block: It displays an image utilizing the data of another block.
- JavaScript Code Block: Guests can run JavaScript code with data from other blocks and the result of the execution is made available to other blocks.
- Local File Import Block: It allows guests to provide their own data for blocks.
- Media Collection Block: A collection of media files is made available as data for other blocks.
- Plotly Chart Block: It visualizes the data of another block using Plotly.
- Python Code Block: Guests can run Python code with data from other blocks with the use of Pyodide and the result of the execution is made available to other blocks.
- R Code Block: Guests can run R code with data from other blocks with the use of WebR and the result of the execution is made available to other blocks.
- Share Block: Guests can share the state of a page with other visitors, allowing them to reproduce it.
- Slider Block: It gives guests the possibility to choose a value or a range within a specified boundaries.
- Text Editor Block: It allows to share text content like JSON or XML with other blocks.
- Text Viewer Block: It displays text content like JSON or XML from other block.
- Web API Block: It enables to call a web API and to share this data with other blocks.
- Zenodo Repository Block: Using a DOI, a dataset can be loaded from Zenodo.org and shared with other blocks.
inseri name comes from the Latin insero which means to sow, to plant but also to insert.
- More information about the project can be found at here.
- For examples and showcases see here.
- Detailed documentation is available at inseri-swiss.github.io/inseri-core-wp.
- Try out our Playground.
- For Ideas and Questions please use GitHub Discussions.
- Bug and Issue reports are welcome on GitHub Issues.
- The development takes place on GitHub.
Do you want to get regular notifications? Watch the GitHub repository!
Do you want to show your interest? Star the GitHub repository and Follow inseri.swiss organization!