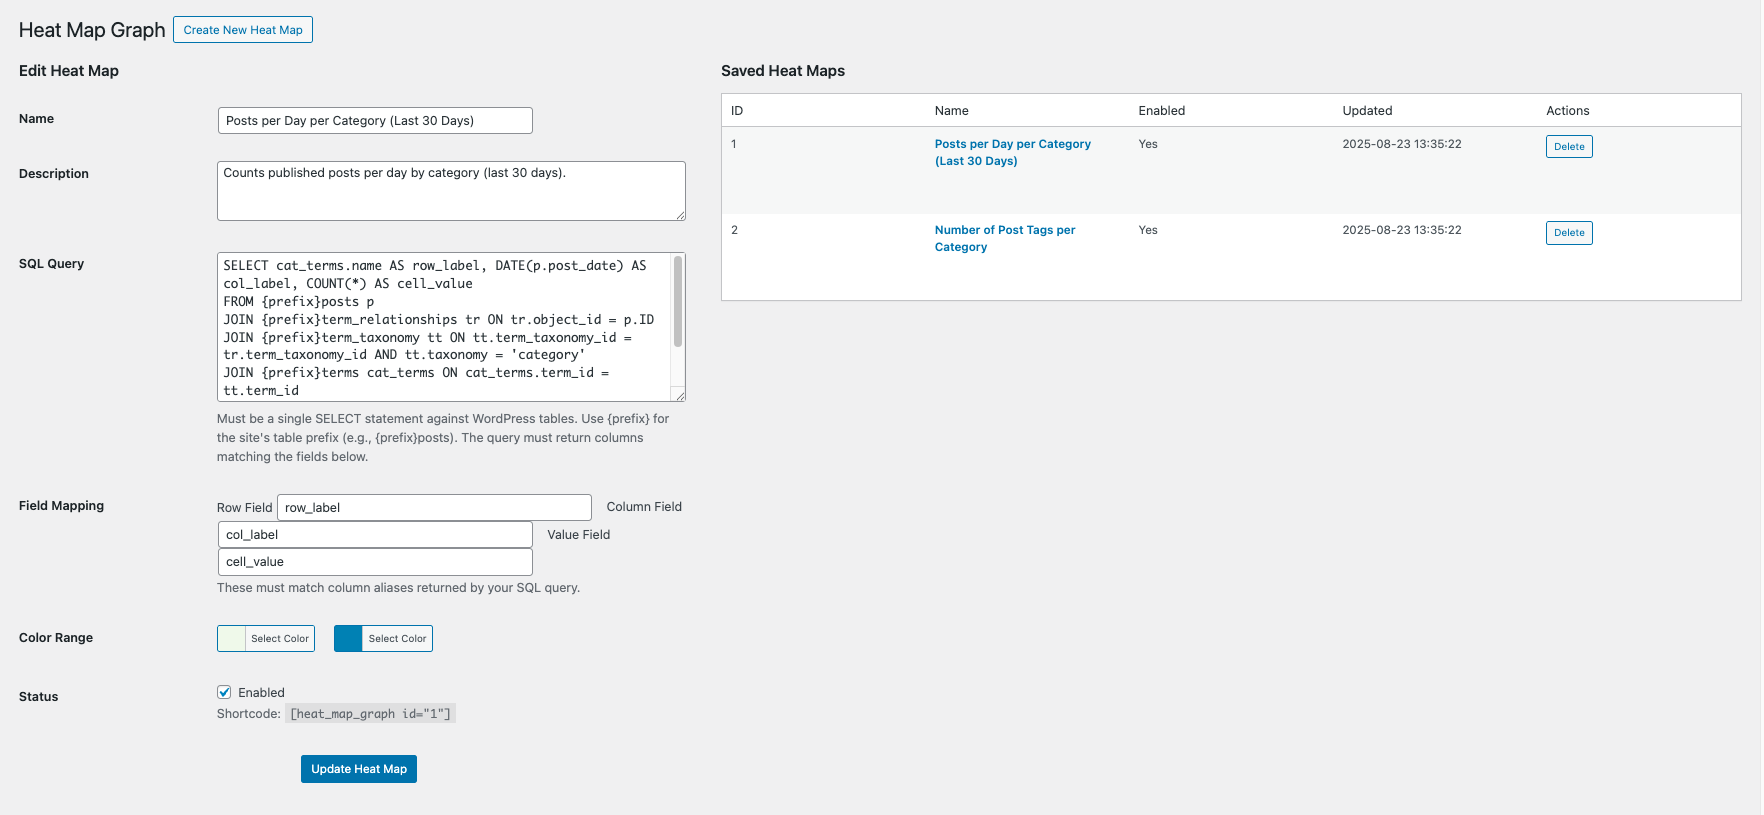
Heat Map Graph lets administrators build data heat maps backed by SQL SELECT queries on WordPress tables. Configure:
- Query: a single SELECT statement targeting WP tables
- Field mapping: row, column, and value fields produced by the query
- Color range: hex colors for min and max
- Status: enable/disable
Use the shortcode on pages/posts:
[heat_map_graph id="123"]
Security features:
– Validates SQL is a single SELECT against WP tables only
– Blocks DML/DDL keywords
– No multiple statements
– Admin-only UI with nonces and strict sanitization
On activation, two sample heat maps are created:
– Posts per Day per Category (Last 30 Days)
– Number of Post Tags per Category
Active installations0+
Weekly downloads
34–
Version1.0.0
Last updated8/23/2025
WordPress version6.0
Tested up to6.8.2
Tags
analyticschartsheatmapshortcodesql