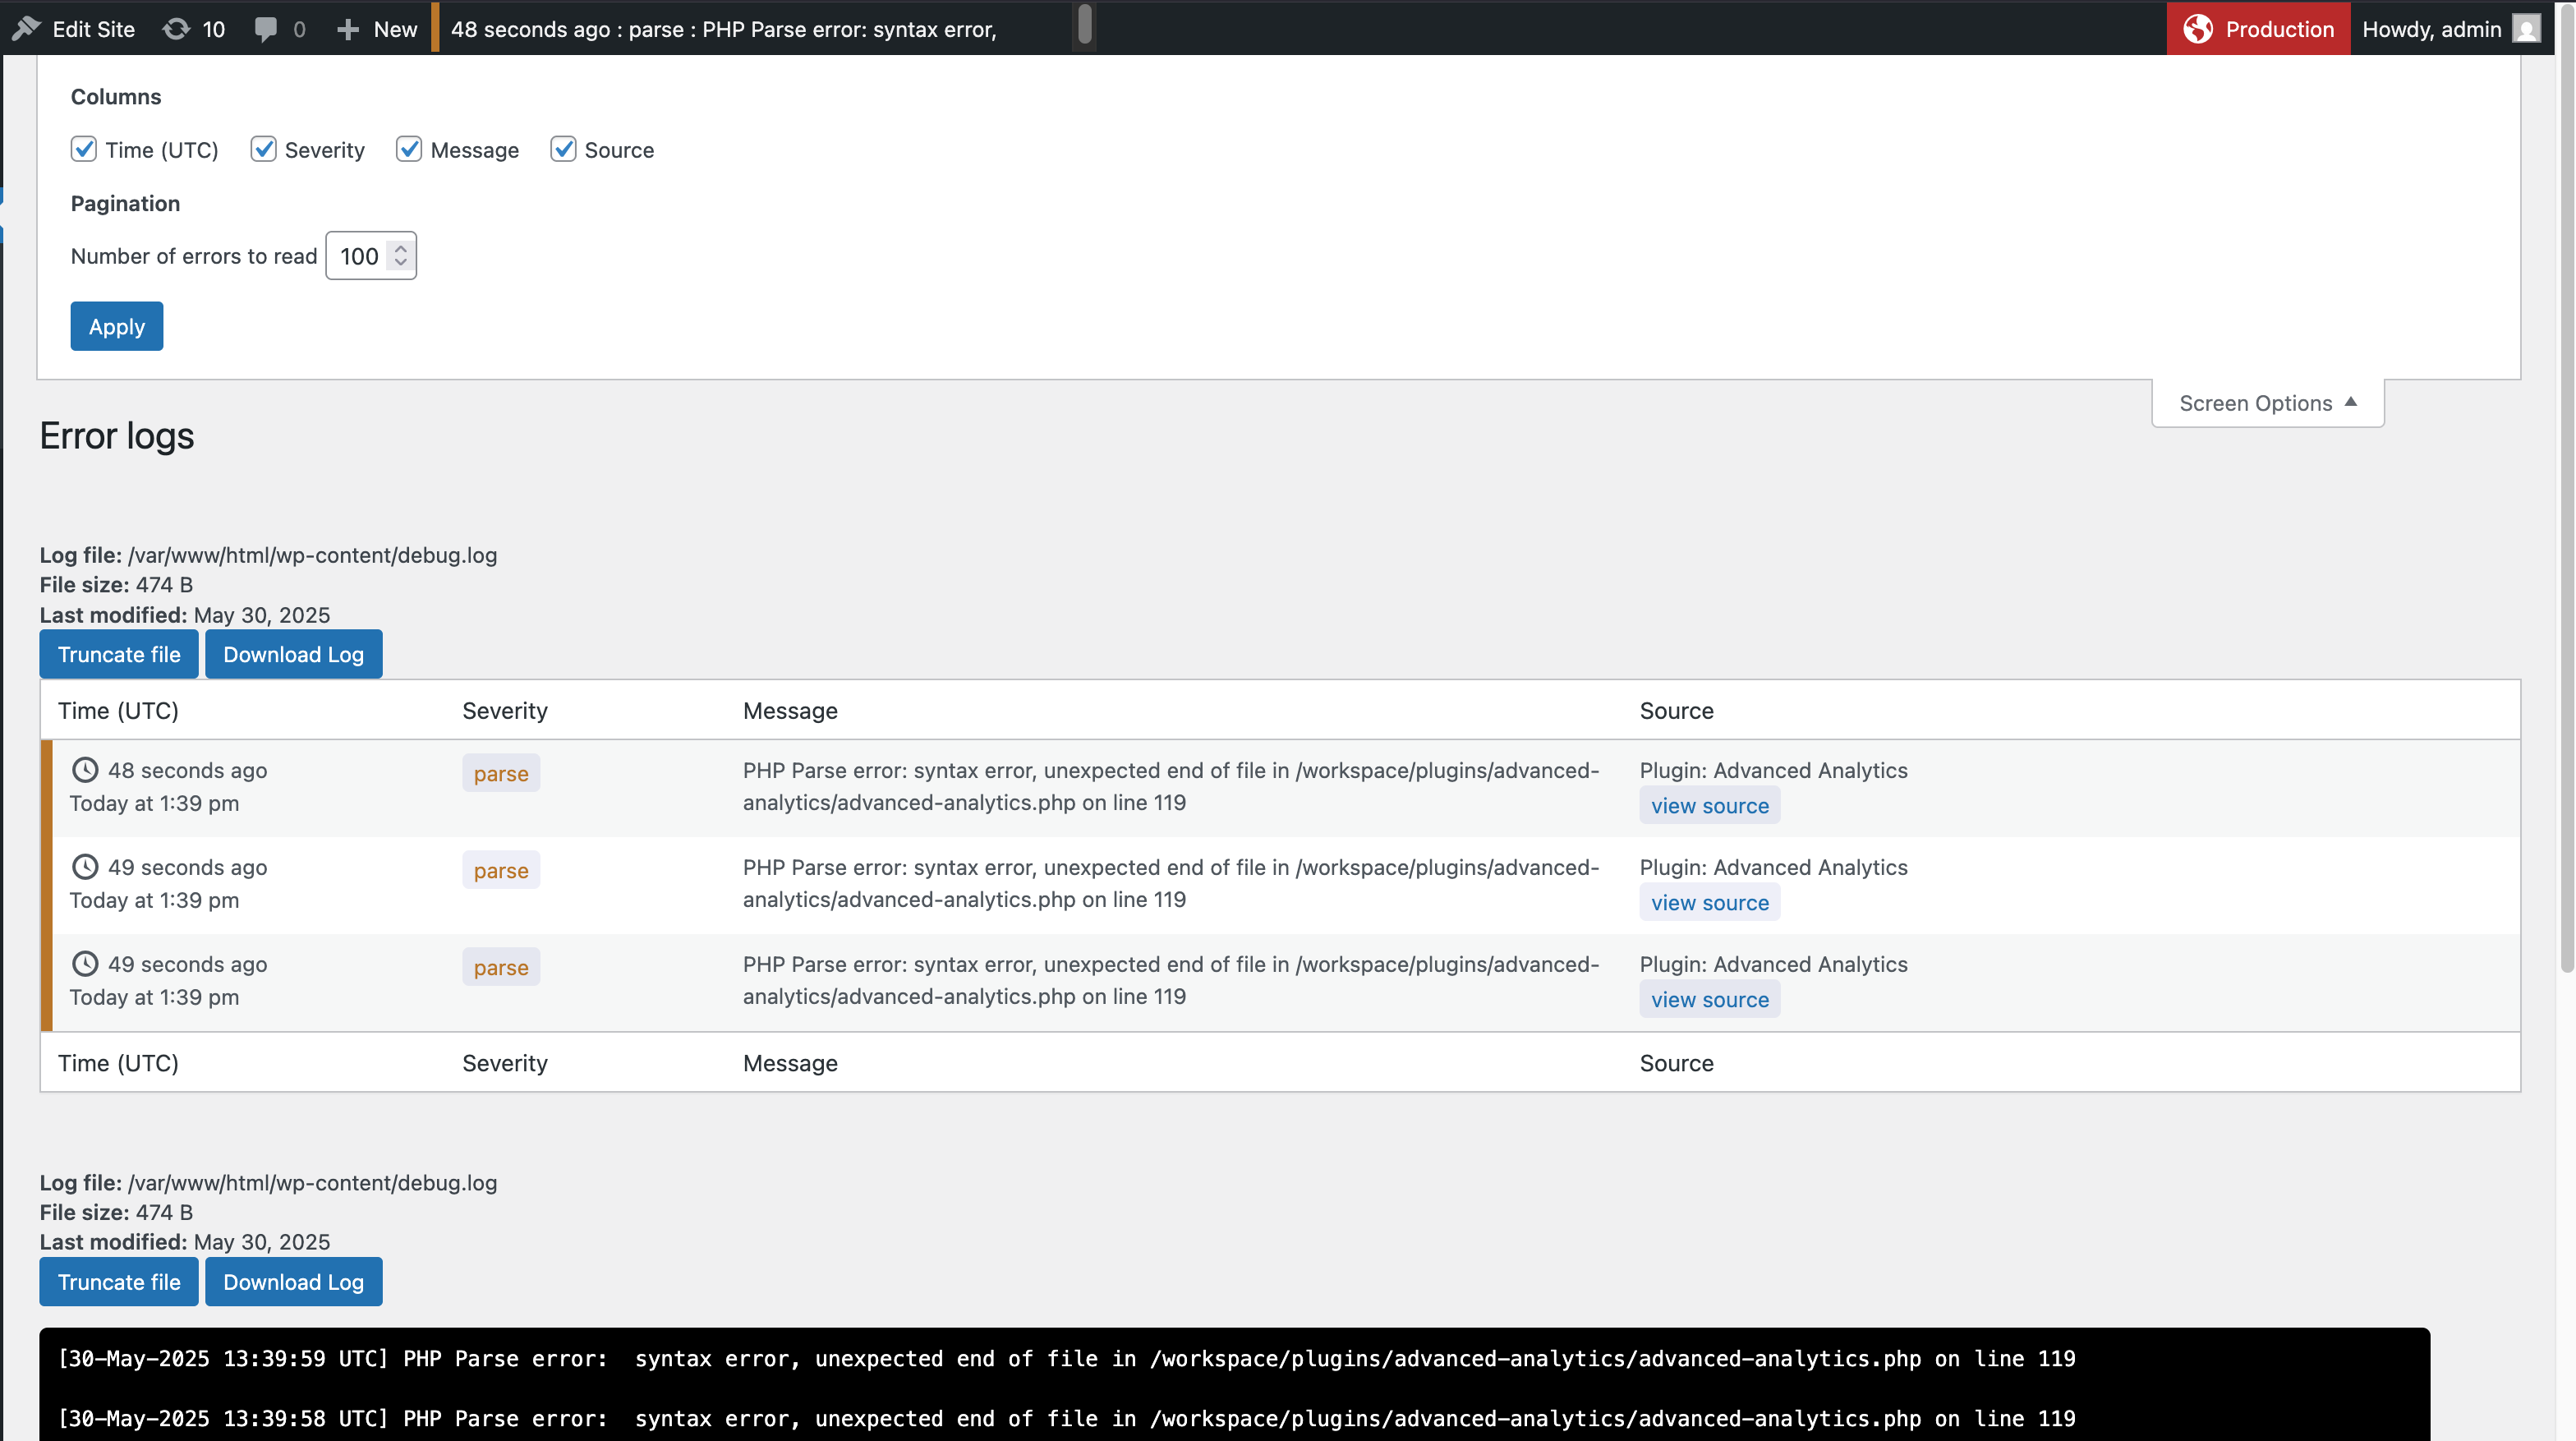
Error Log Overview
0 Day Analytics helps detect, inspect and respond to PHP and WordPress-level
errors before they become production incidents. It is optimized for very
large logs and common debugging/operational workflows.
Core capabilities:
– Efficiently reads very large (GB-sized) error logs without full-file reads.
– Error Log Manager with search, filtering, and code-context viewing.
– Cron Manager: list, edit, run, delete scheduled tasks; advanced filters.
– Transients Manager: safely list, edit, delete DB transients.
– Requests Viewer: inspect outgoing HTTP requests.
– Mail Logger & Composer: record email history, view attachments, compose/send.
– SMTP configuration and test email support.
– DB Table Manager: inspect/delete records across tables.
– Server Info: admin-bar badges and dashboard widget (CPU, memory, disk).
– Plugin Version Switcher, Code Snippets module, code viewer, CSV export and dark mode.
– Recovery Mode: one-time recovery links with Slack/Telegram/other channels.
– Randomize error-log filename for security.
– PHP Snippets: generate and execute your own snippets when you need them. Shortcodes are supported.
– WP Hooks capturing / monitoring – very powerful tool to capture and monitor different (defined or custom) WP hooks (actions and filters). You can see selected or added hook output (result of triggering).
Short Description
Real-time error insight and recovery for WordPress — lightweight, fast
troubleshooting toolkit with log management, cron/transient/request viewers,
mail logging/composition, SMTP, and a recovery mode.
Requirements & Compatibility
- WordPress 6.0+ (tested up to 6.9)
- PHP 7.4+ (compatible with PHP 8+)
- Not intended as a multisite recovery tool (see notes below)
Best practices & Security Notes
- Keep log files outside the webroot when possible, or restrict access via
server rules (.htaccess / nginx) to avoid public exposure. - Use a randomized or non-obvious filename for error logs if stored in webroot.
- Limit plugin capabilities to trusted administrators (capability checks).
- Sanitize and escape all output; use nonces for state-changing actions.
- Secure SMTP credentials and prefer TLS/STARTTLS.
- Set file permissions tightly (e.g., 600/640) and restrict ownership to the
web server user. - Backup database/files before bulk delete or run operations.
- Disable or restrict high-frequency background polling in high-load sites.
Usage notes & performance
- Default error history stores the last 999 errors (adjustable via Screen
Options) to preserve performance on high-volume logs. - No pagination on error logs by design to avoid repeated full-file reads.
- Optional DB-based PHP error logger exists for environments without disk
logging; consider DB size and retention.
Support & Notes
- Recommended: secure log paths and consider randomizing filenames.
- Disable unused modules to reduce footprint and attack surface.
- Recovery mode is limited on multisite installs due to WP core behavior.
- For bugs, feature requests or support, open an issue on the plugin page.
Live preview and full details:
https://wordpress.org/plugins/0-day-analytics/